Hillsboro Beach, FL, USA

PEM used on a highly eroding beach downdrift of groins

The first US project was installed at Hillsboro Beach in February 2008 on a critically eroding part of the Atlantic coast 25 miles north of Miami.

From 2001 to 2007 the project area R7-12 had suffered an average annual loss of -3.9 cy/ft from R-monument line (in the dune) to Depth Of Closure (-16.5ft). During the same period, the controls had gained +1.9 cy/ft in North and +1.2 cy/ft in South. According to the Florida Department of Environmental Protection (FDEP) they "knew of no technology that would work at the exact location (R7-12) due to groins at Deerfield Beach (R6)".

The test area was two miles long of which one mile had 90 PEMs installed (R7-12) vertically in the beach in 33 lines perpendicular to the shoreline. Half a mile of beach North and half a mile South of the project area served as controls and had no PEMs installed.

A Pilot Study prior to the full installation showed that the beach had a very high groundwater pressure. This is a factor that contributes to erosion. The PEMs are designed to improve drainage and thus reduce groundwater pressure.

The beach had lost a lot of sand prior to the installation, and over half of the PEMs had to be reduced in size as the layer of sand was very thin.

Two minor truck hauls have taken place in and around the project area, and the effect of these have been filtered out in all the volume calculations below.

For PEM to meet the financial success criteria the project area had to do 25% better than the controls.

The Hillsboro Beach project was presented at the ASBPA conference in 2016 and the poster with the 3-year result can be seen here.

An abstract from a presentation at the international ICCE 2018 conference can be found here and a full paper here.


Hillsboro Beach project location-001

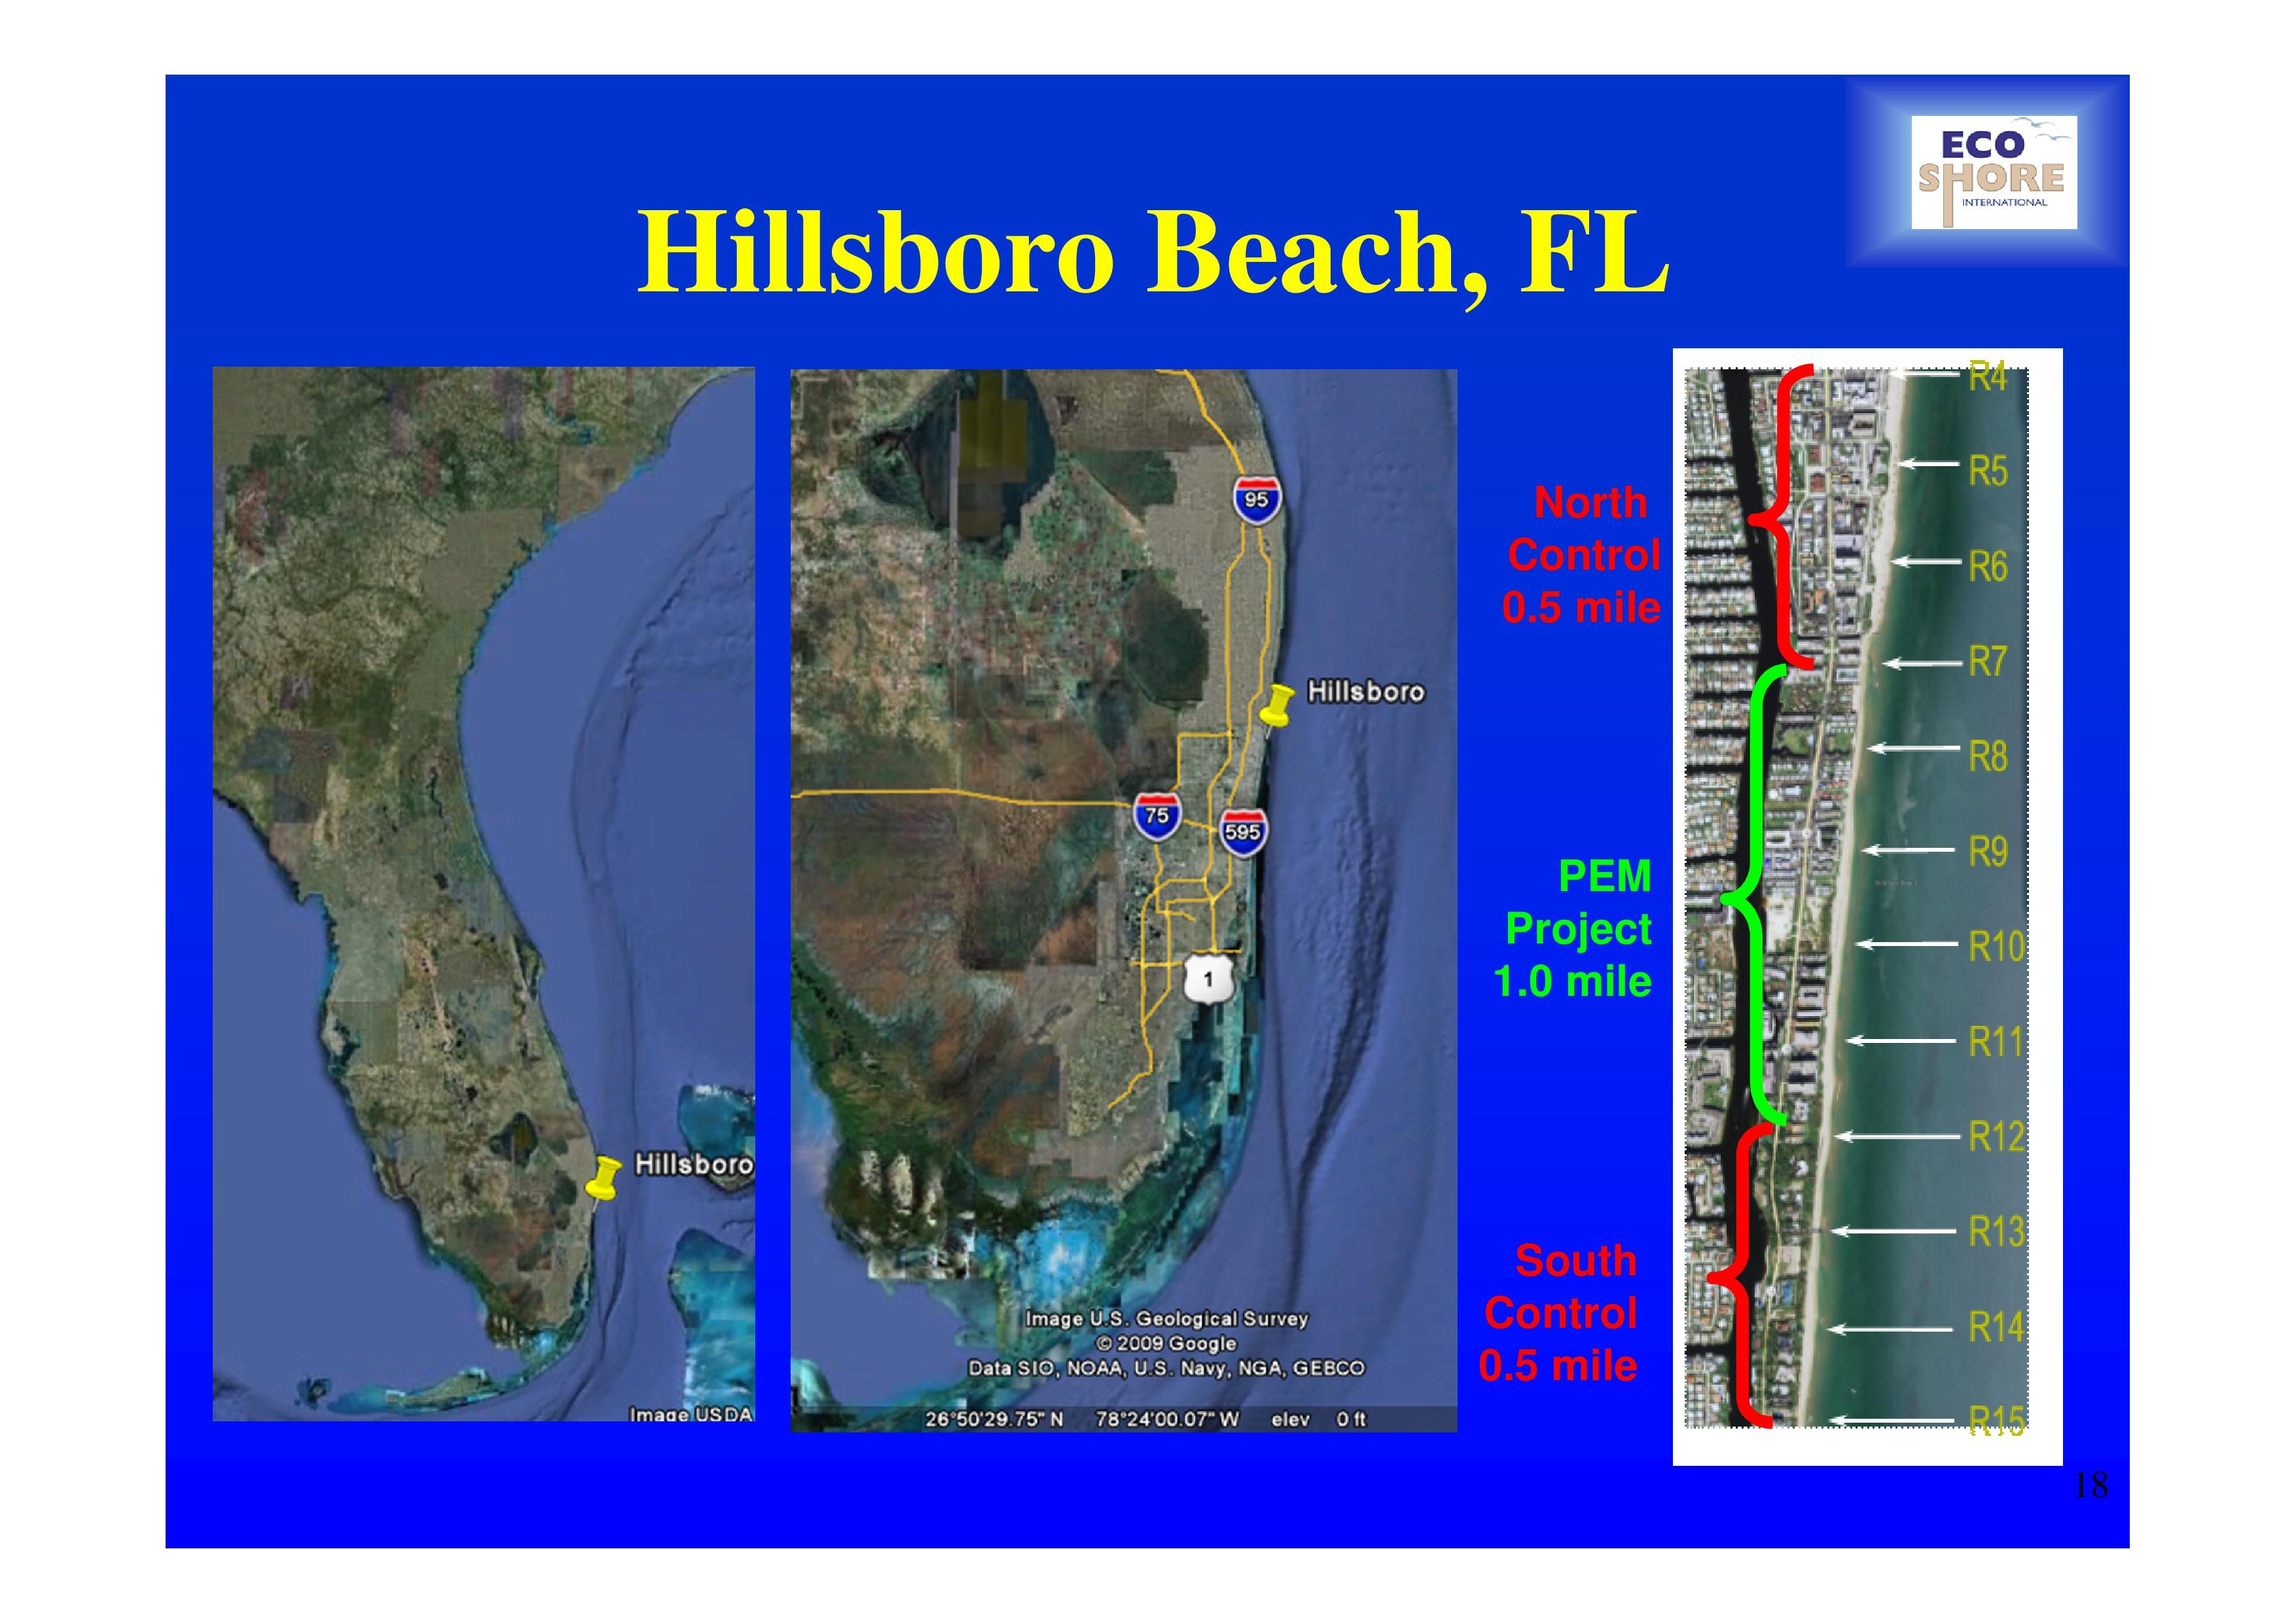
Fig. 1 Project location in Florida, USA


 18-Months Results

Change in volume from R-monument line to -5ft.

Above –5ft NAVD the volume changes from March 2008 to August 2009 are +5.96 cubic yards per shore foot (cy/ft) in the PEM area, and +0.91 cy/ft, +2.04 cy/ft in the North Control and South Control area, respectively. See Fig.2
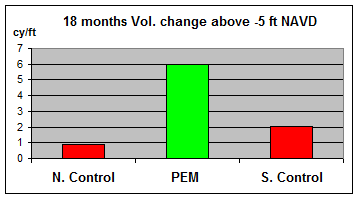
-5ft

Fig. 2

Change in volume from R-monument line to DOC

The volume changes from March 2008 to August 2009 above Depth of Closure (DOC) are +1.2 cy/ft in the PEM area, and –3.32 cy/ft and –3.24 cy/ft in the North Control, and South Control area, respectively. See Fig. 3.
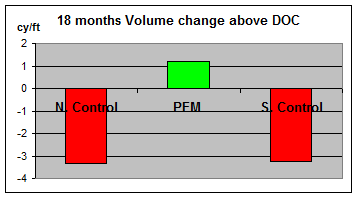
doc

Fig. 3

The volume change to Depth Of Closure in the PEM area was +24,300 cubic yards. 

No negative effects were noted down-drift, where the beach advanced 2.5ft in 18 months.

The potential effect on turtles has been investigated by Curtis M. Burney, PhD, Nova Southeastern University, Oceanographic Center, Florida. No negative effects were found on turtle nesting, nesting success or hatchlings emergence.

Similarly no effects on shorebirds were reported either and no other adverse effects have been noted.

No incidents involving people have been reported.

Qualitatively the beach looked in better shape than prior to the project, and the Beach Raker, who drove the beach every day, claimed that for the first time in several years, he was able to drive the entire coastline from Port de Mer to south of the project area on the dry beach.

Letter of support from Hillsboro Beach

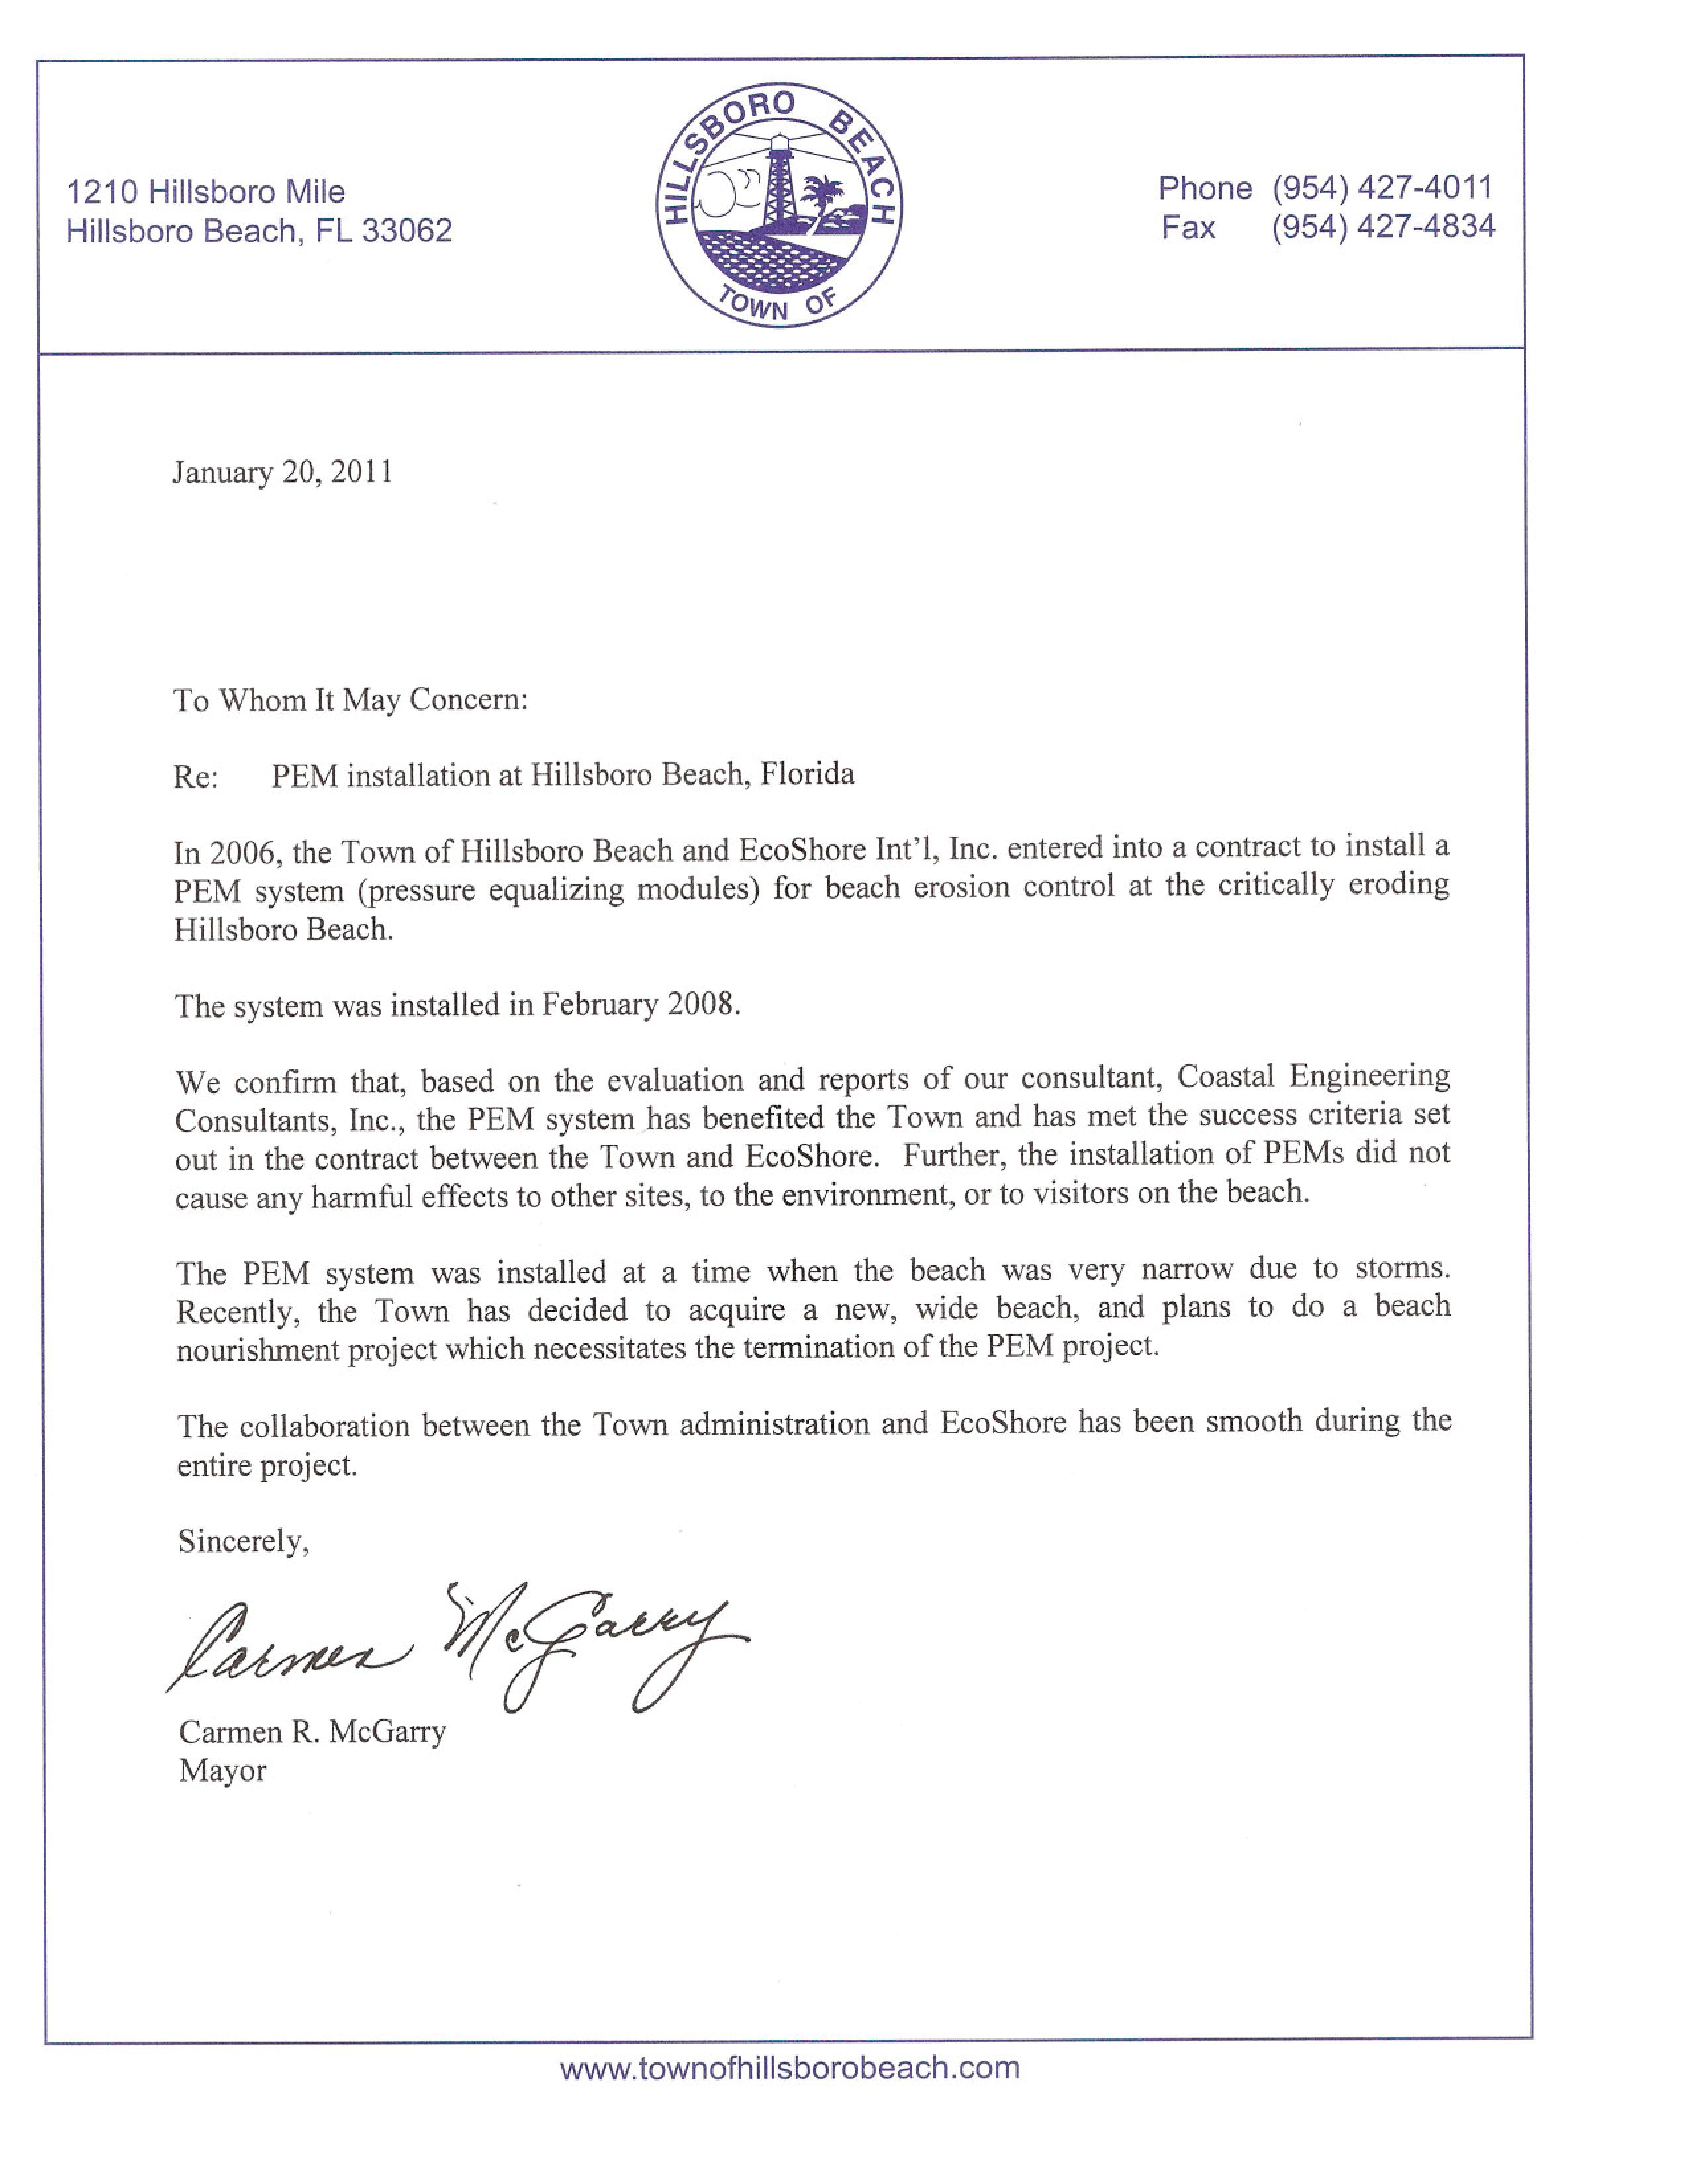
Fig 4. Letter of Support from Hillsboro Beach

Based on the encouraging results it was an optimistic team that presented the data to the Town. As the first US client the Town had received a no-cure no-pay contract. Only if the PEM project area met the financial performance criteria of being 25%  better than the controls the Town had to pay. As you can see from the EcoShore report to FDEP and the CEC report to the Town the criteria were more than met.

The Town paid the fee and then .....


Town decides to have beach nourishment.

In spite of the encouraging results, and that all success criteria had been met, a narrow majority of the Town commission decided to opt for beach nourishment. In Fig. 4 you can see the letter from the town.

It was decided to leave the PEMs in the beach until shortly before the nourishment, which made it possible to monitor the project for 3 years, in accordance with the originally plan. Surveys were made by the same certified Florida surveyor, SEA Diversified, which had supplied all the previous surveys.

The PEMs were removed after they had been installed for 3 years. Removal was performed by the same company that installed the PEMs, and a report was made to the Town on the findings during removal. The location of each removed PEM was recorded and compared to the recording at the exact same spot 3 years earlier when the PEM was installed. This provided a very exact picture of how the beach had developed during the full 3-year period.


3-Year Results 


Change in beach elevation at exact PEM location

In January 2011 the PEMs were removed.
The elevation of the beach at each removed PEM was recorded with high precision GPS equipment.
The elevation was compared to the elevation at the exact same spot 3 years earlier.
If the beach had behaved like the previous decades it would have eroded several feet.
However, the beach had not eroded. On average the beach had increased by approx. 1 ft.
See details in Table 1.

avg PEM elevation Hills 3 yrs

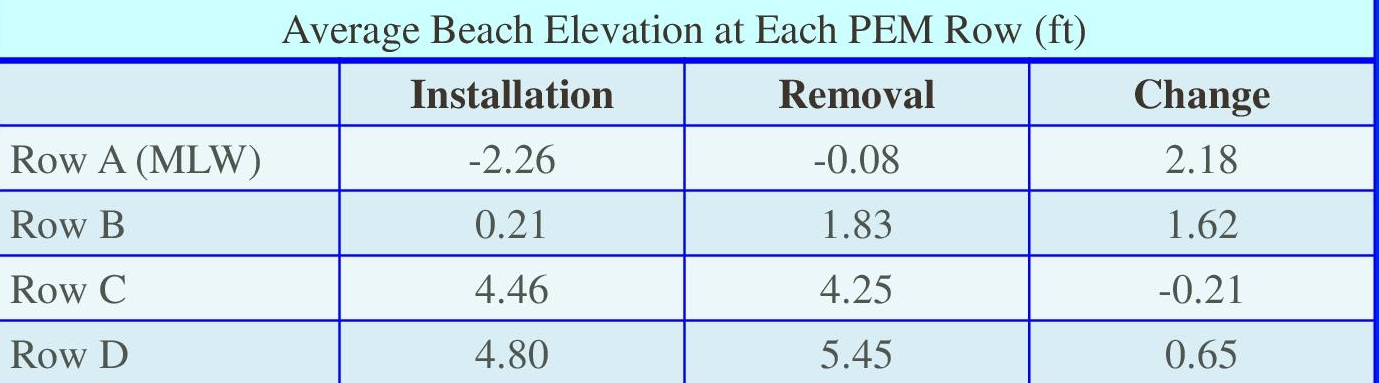
Table 1 Beach elevation at installation and removal for each removed PEM


Hillsb. Beach 0 yr Feb 14, 2008 Low tide (1024x768)

Fig. 5. Hillsboro Beach at R7 a few days before PEM installation


Photos looking South towards R7

Photos were shot at the time of installation (Fig.5)  and removal (Fig.6) of PEM and is a visual representation of Table 1.

 Both photos were shot at low tide.
Some of the sand at R7 (Port de Mer - the two yellow buildings) was placed in April 2008.
Unlike previously (1998) the sand did not wash away but instead increased to more than double.

For a timeline from 2008 to 2014 at R7 Hillsboro Beach see further down.

Hillsb. Beach 3 yr Jan 22, 2011 Low tide enha.

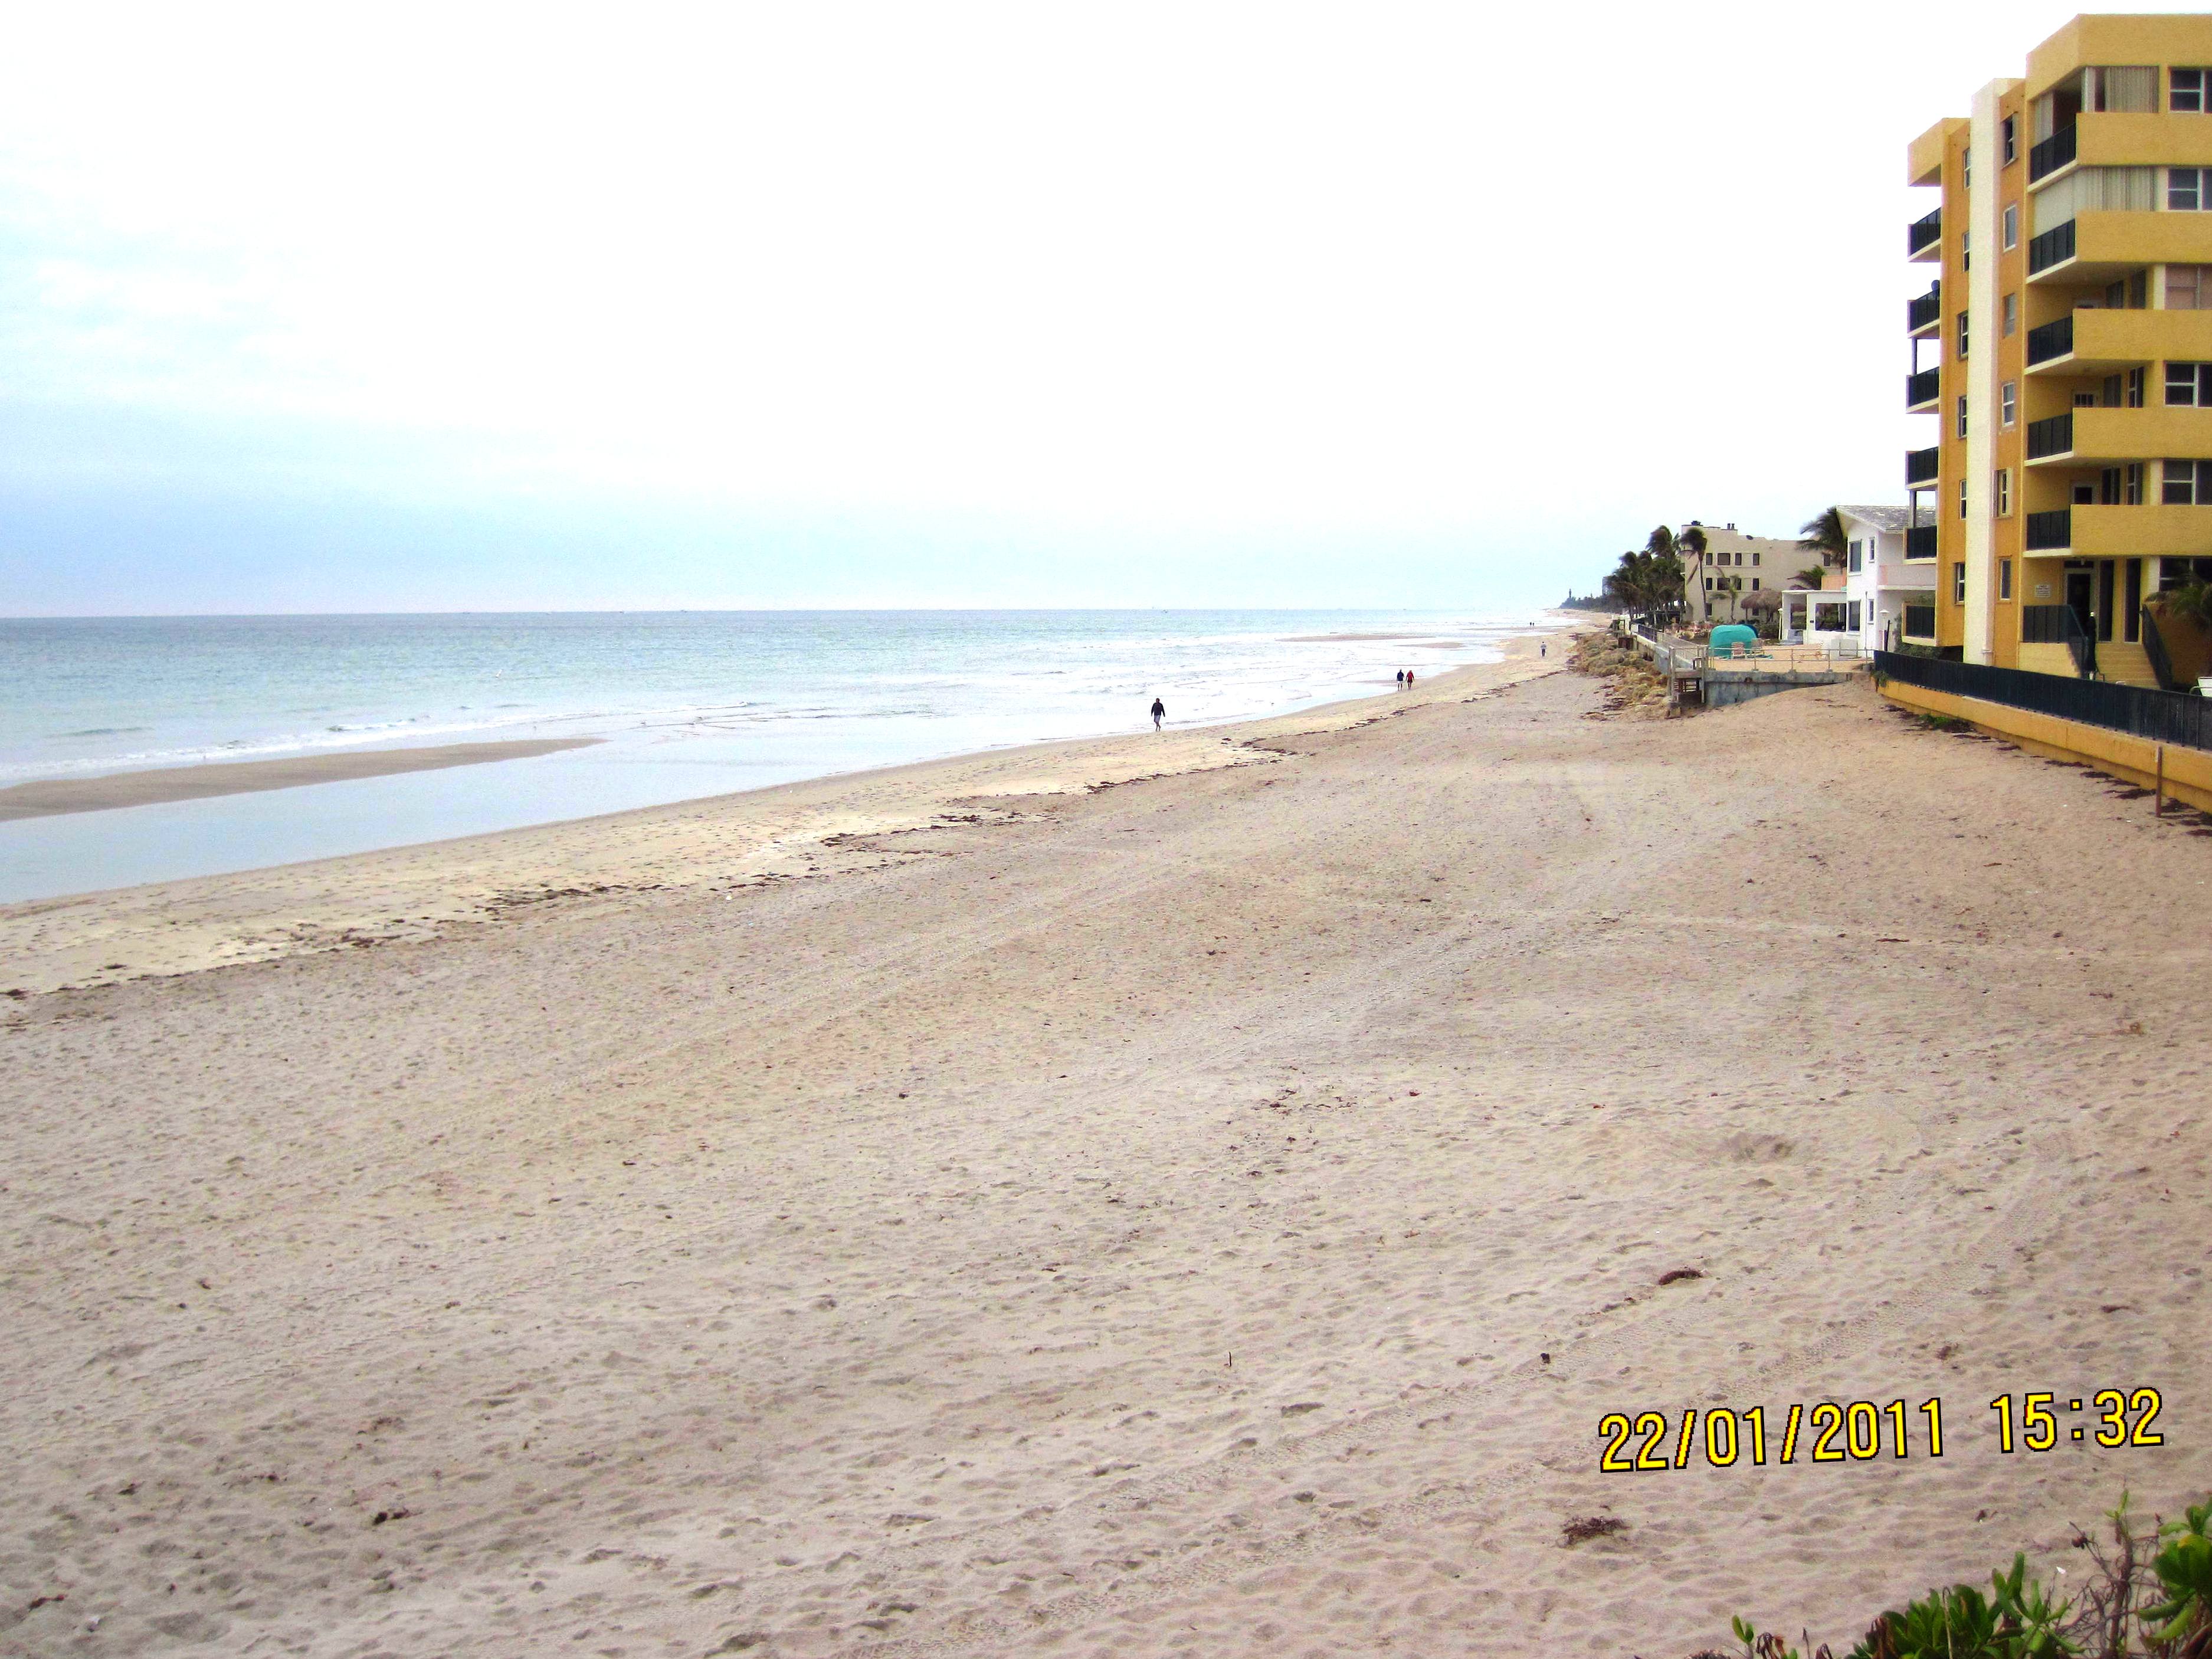
Fig. 6 Hillsboro Beach at the time of removal of PEM. Click on photo to see details.


Aerial photos of Hillsboro Beach

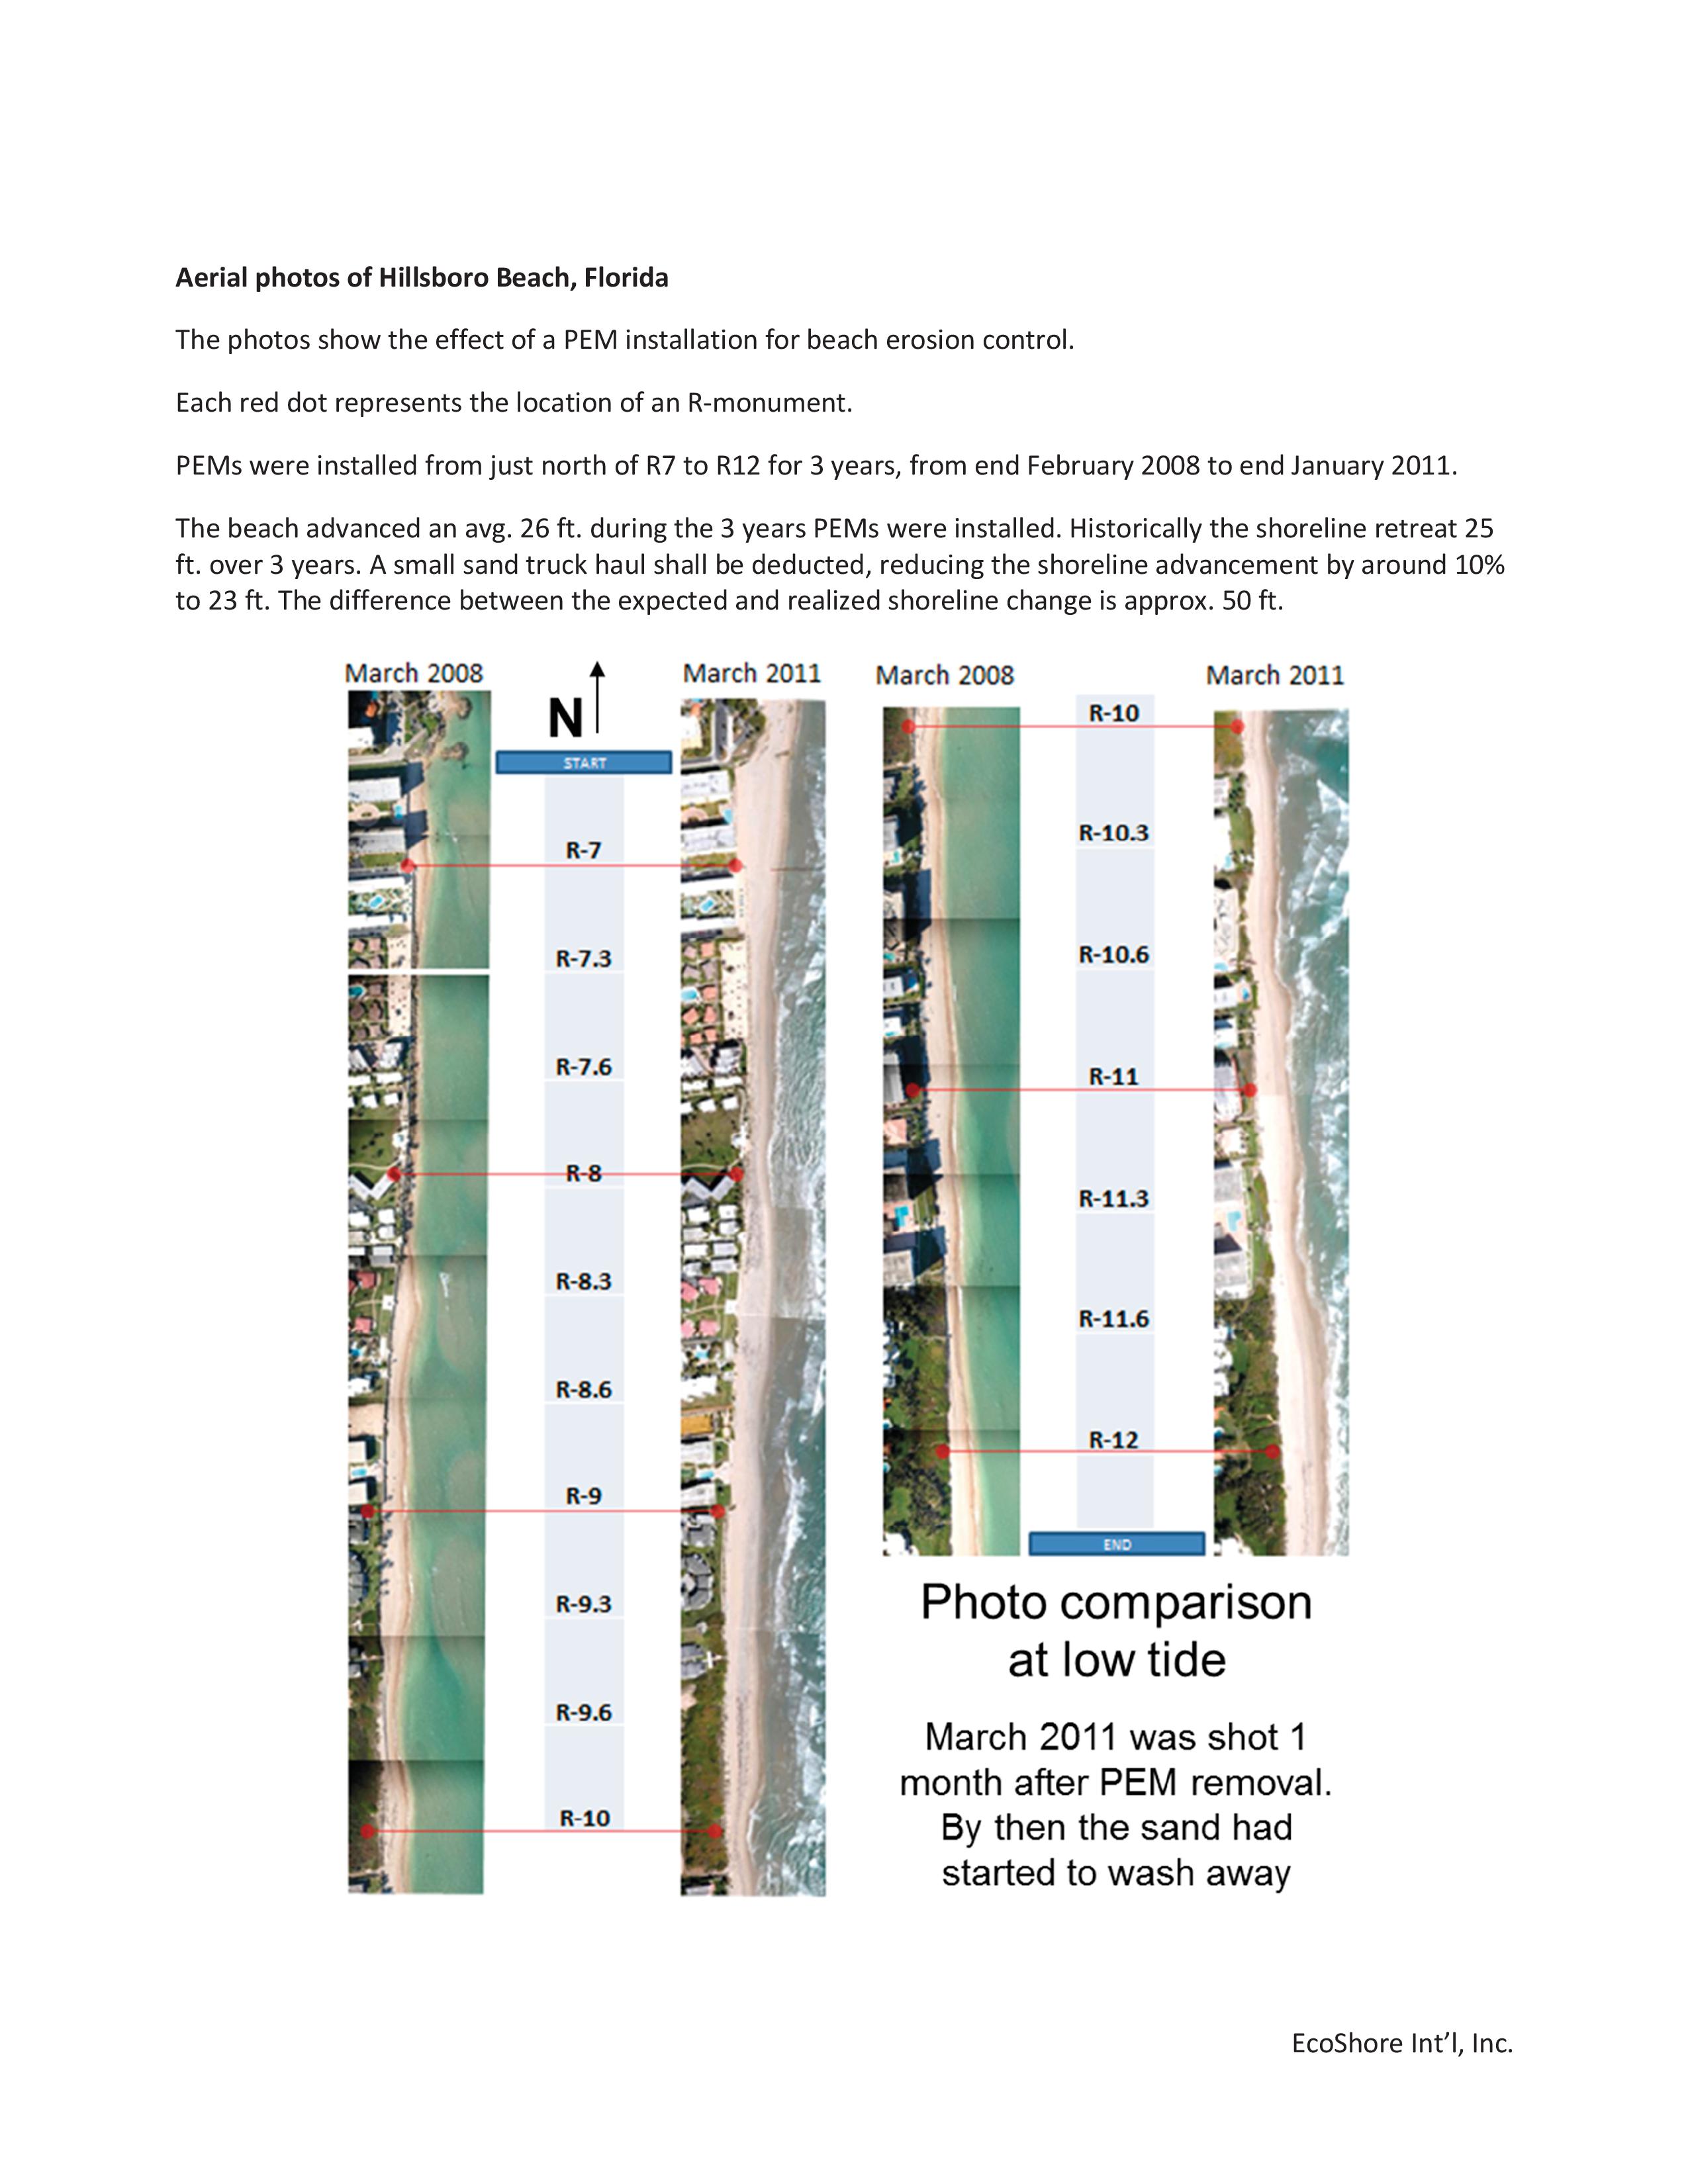
Fig. 7 Shoreline change


Shoreline change

Fig 7. Shoreline change from project start to one month after removal of PEM.

Shoreline advanced 26.9 ft.
Shoreline was expected to retreat 25.2 ft over 3 years.  

Volume change

Volume change to Depth Of Closure (DOC) from project start to one month after removal of PEM.

Accumulated sand to DOC: 47,000 cubic yards (cy)
Sand placed during test (truck haul): 8,500 cy
Net added in PEM area (47,000 - 8,500) = 38,500 cy
Historic loss same area 21,000 cy = -63,000 cy in 3 years


Hillsboro Beach R7 timeline 2008 - 2014

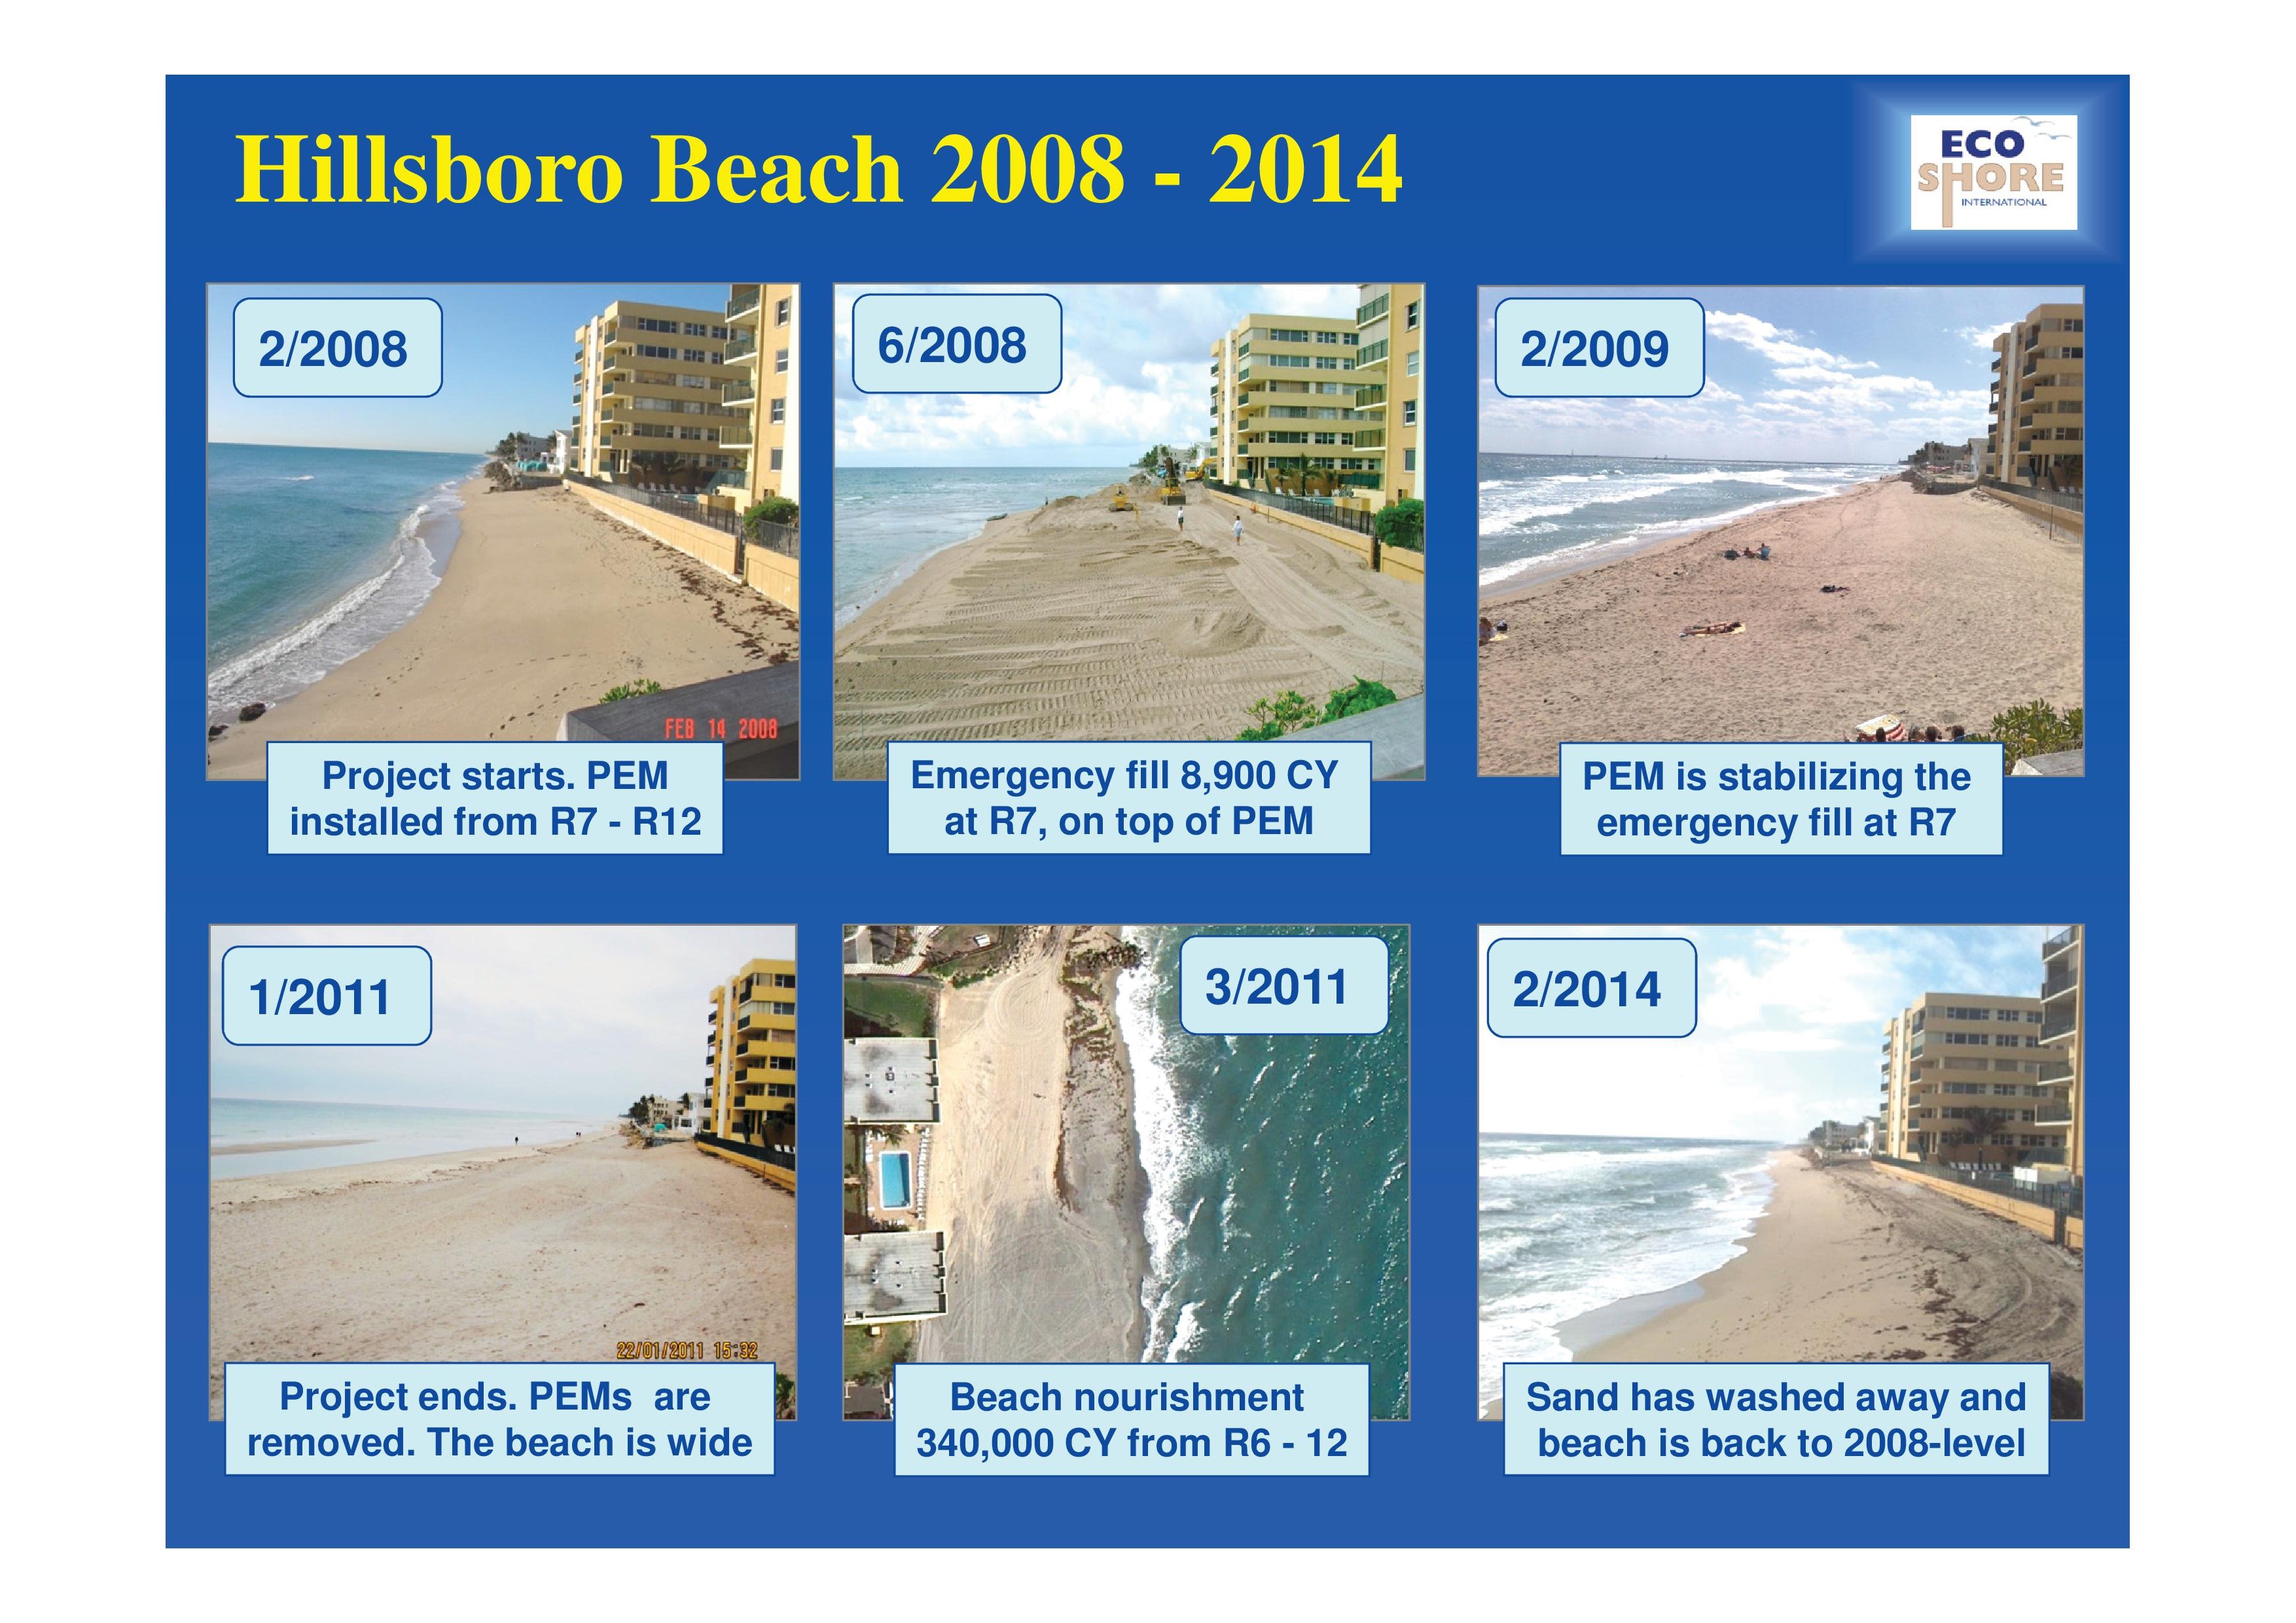
Fig. 8 Timeline from 2008 - 2014

Fig. 8 Timeline illustrates how the PEM system
is able to prolong the life of beach nourishment.